
I help institutions, researchers, and NGOs turn months of work into reports that influence – publications designed to resonate with policymakers, funders, and partners. Your research deserves to be read and understood.
Briefs, studies and handbooks where text carries the message, while design serves navigation, readability and credibility.
Most policy and research publications rely on a text core supported by charts, infographics, and photography.
Analytical publications where charts and visualizations carry equal weight with the text. Heavy infographic work.
I’ve helped organizations, research institutes, and advocacy groups transform complex topics into reports that decision-makers actually read, often in the context of advancing the UN Sustainable Development Goals (SDGs). My work spans fields such as:
I’m happy to work with your existing style guide or template, should you have one. If not, I’ll be happy to create a new design style tailored to your audience, whether they’re high-level officials or the general public.
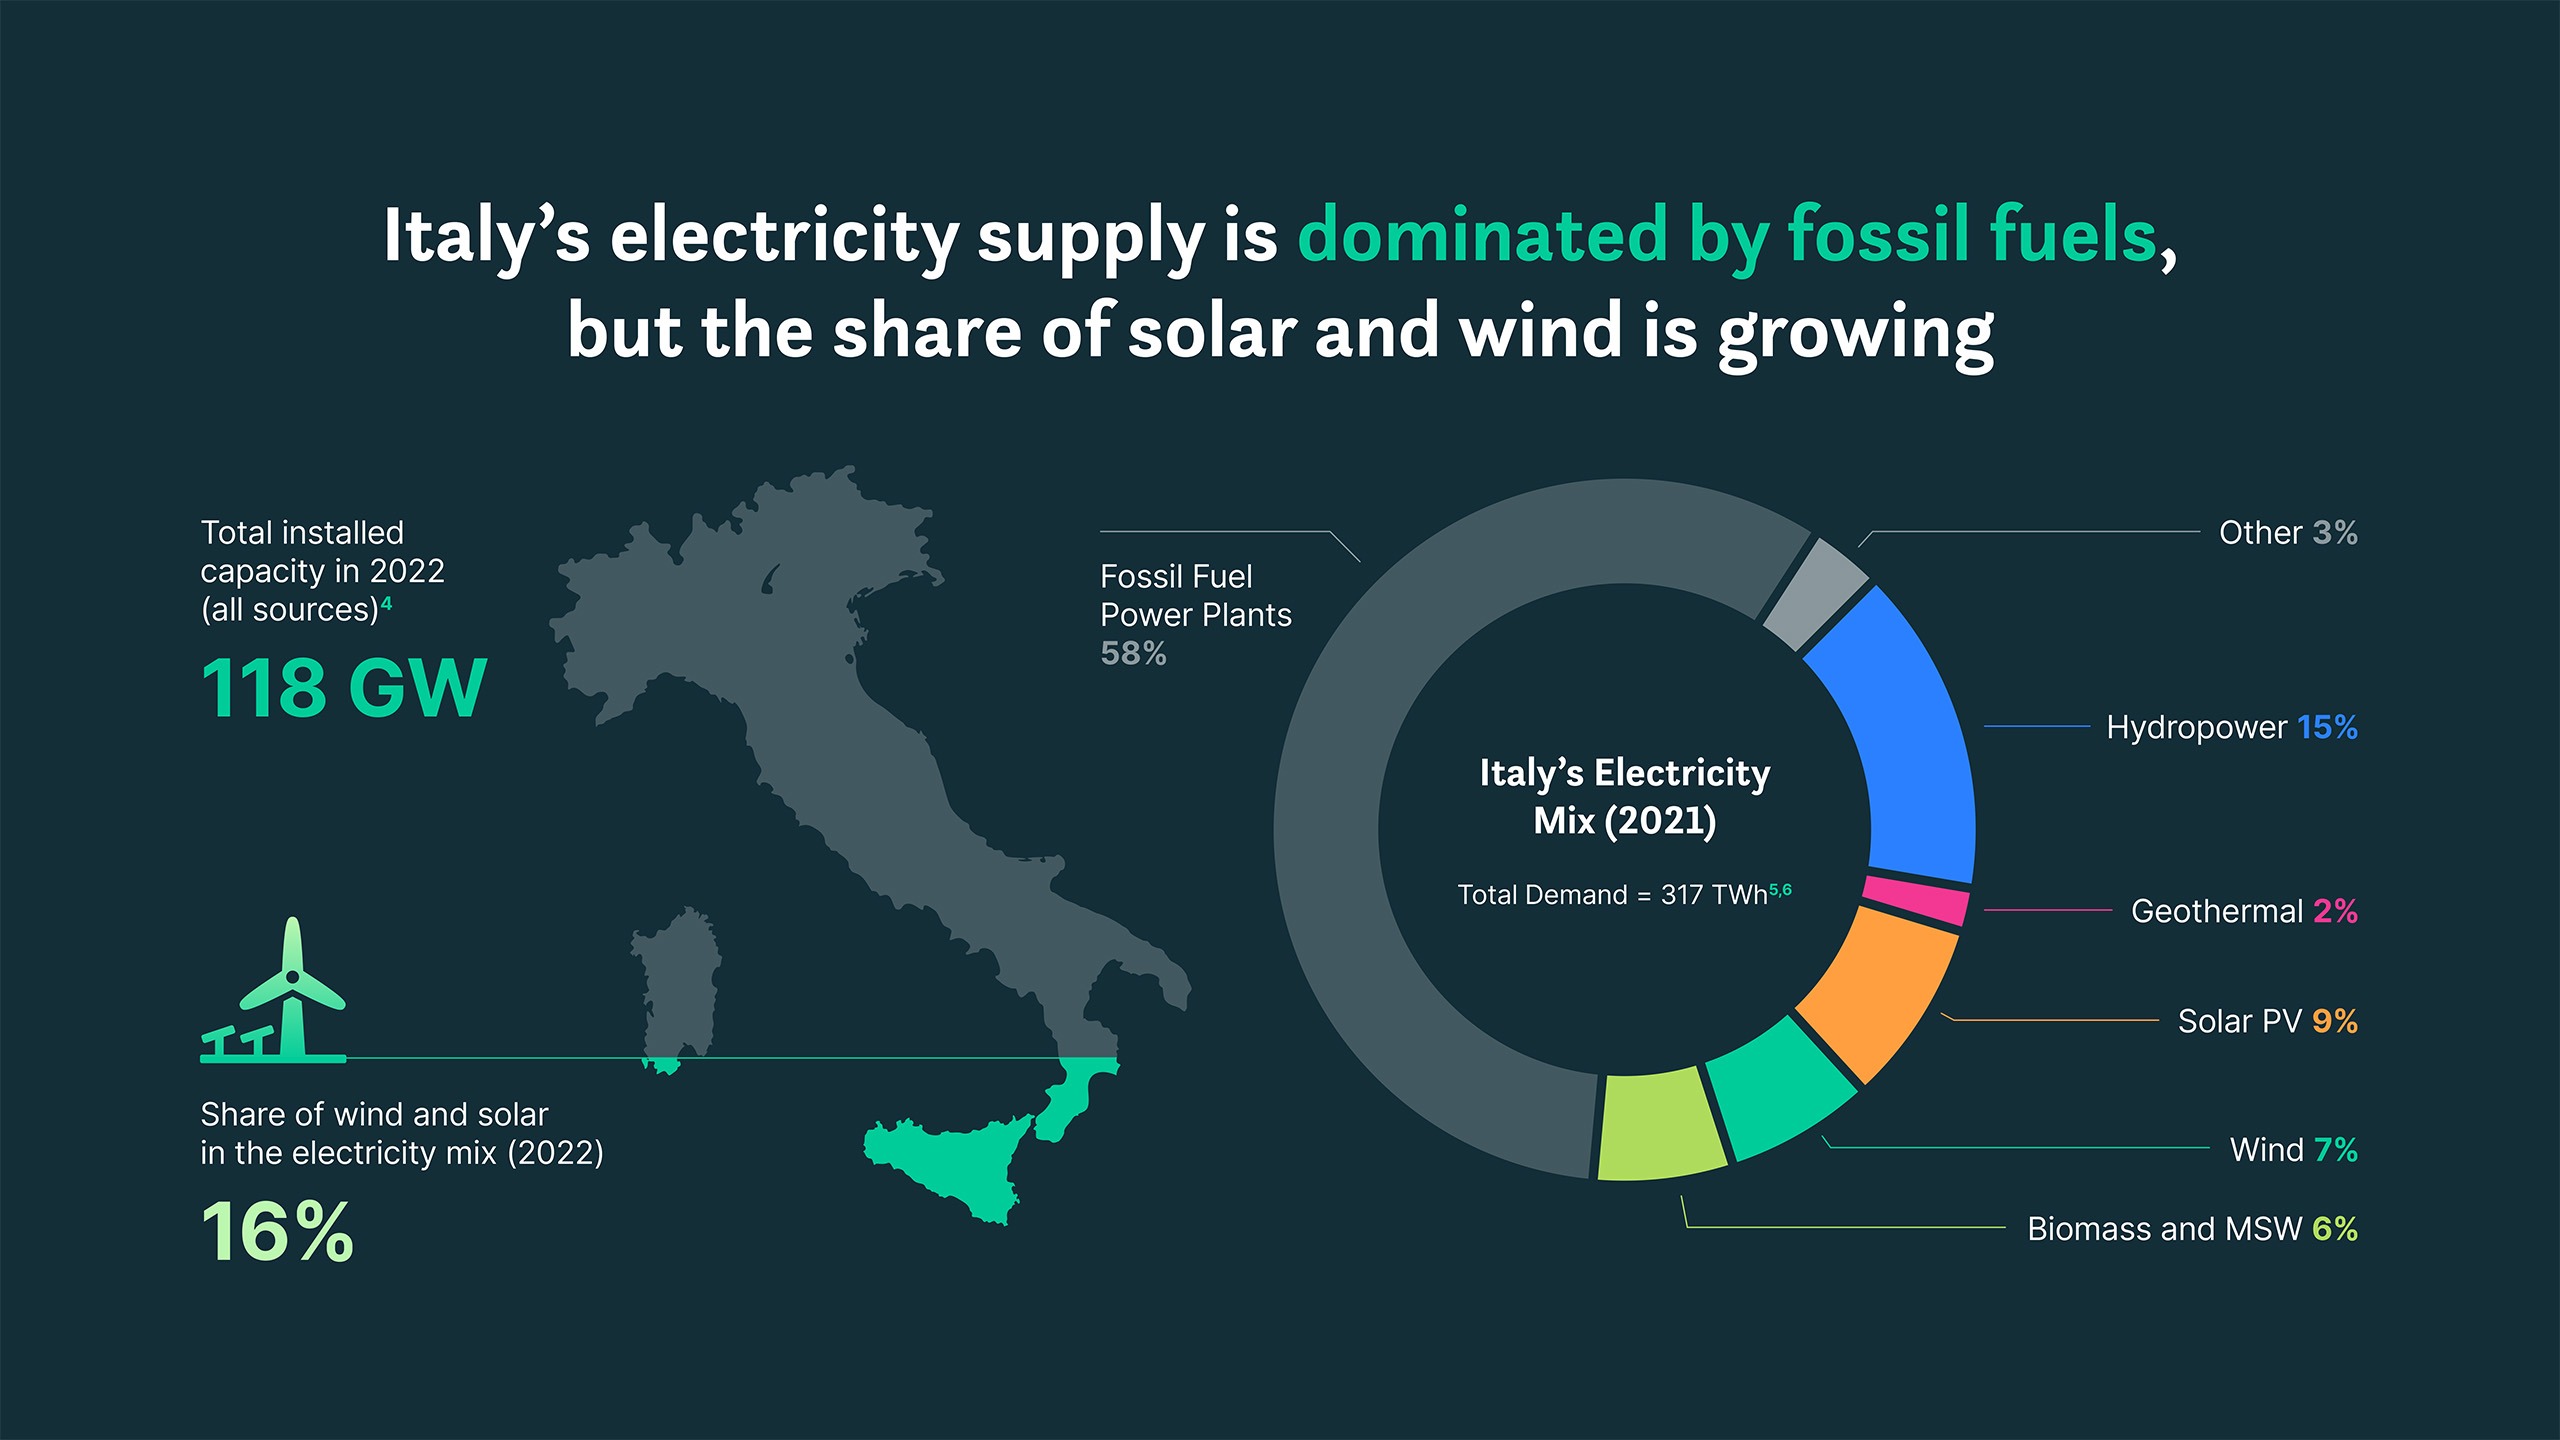
Forget mundane, pixelated charts, often copied from Excel or other publications. I will redraw all charts and infographics in your publication in a unified style. I’ll find creative ways to present any ‘boring’ figures and make sure your audience gets your point.
Policy reports tend to run long. Executive summary, core chapters and appendices all need to work together so that readers can follow the argument without getting lost. For reports where structure itself needs to do communicative work, I also design persistent visual systems across pages.
Don’t worry if you don’t have any nice images to go with your text. I can source and license stock photos, enhance your own, or create bespoke illustration-style visuals – AI-assisted where it serves the concept – in one harmonious style across your publication.
Most policy reports are designed for print and online PDF. Some are online-only and can use non-standard formats, like the 16:9 layout I sometimes use for screen-only reports. I also occasionally build proper web reports – get in touch if that’s what you need.
I have experience designing publications across different writing systems. The report doesn’t need to be in English when it reaches me – I’m comfortable working in almost any language with the right typographic conventions.
I only take on publications I care about. So if we end up working together, it means I’m personally invested in yours. I can be your first reader and test audience. I will tell you if something is unclear. I will do my best to make sure your audience understands your message.
Before the design phase begins, I can help shape the publication itself: chapter structure, editorial flow, and the conceptual design of complex infographics.
If you’re interested in this kind of collaboration, please reach out during the early drafting stages. The earlier we talk, the more this kind of conversation can add. It’s what I call conceptual partnership.
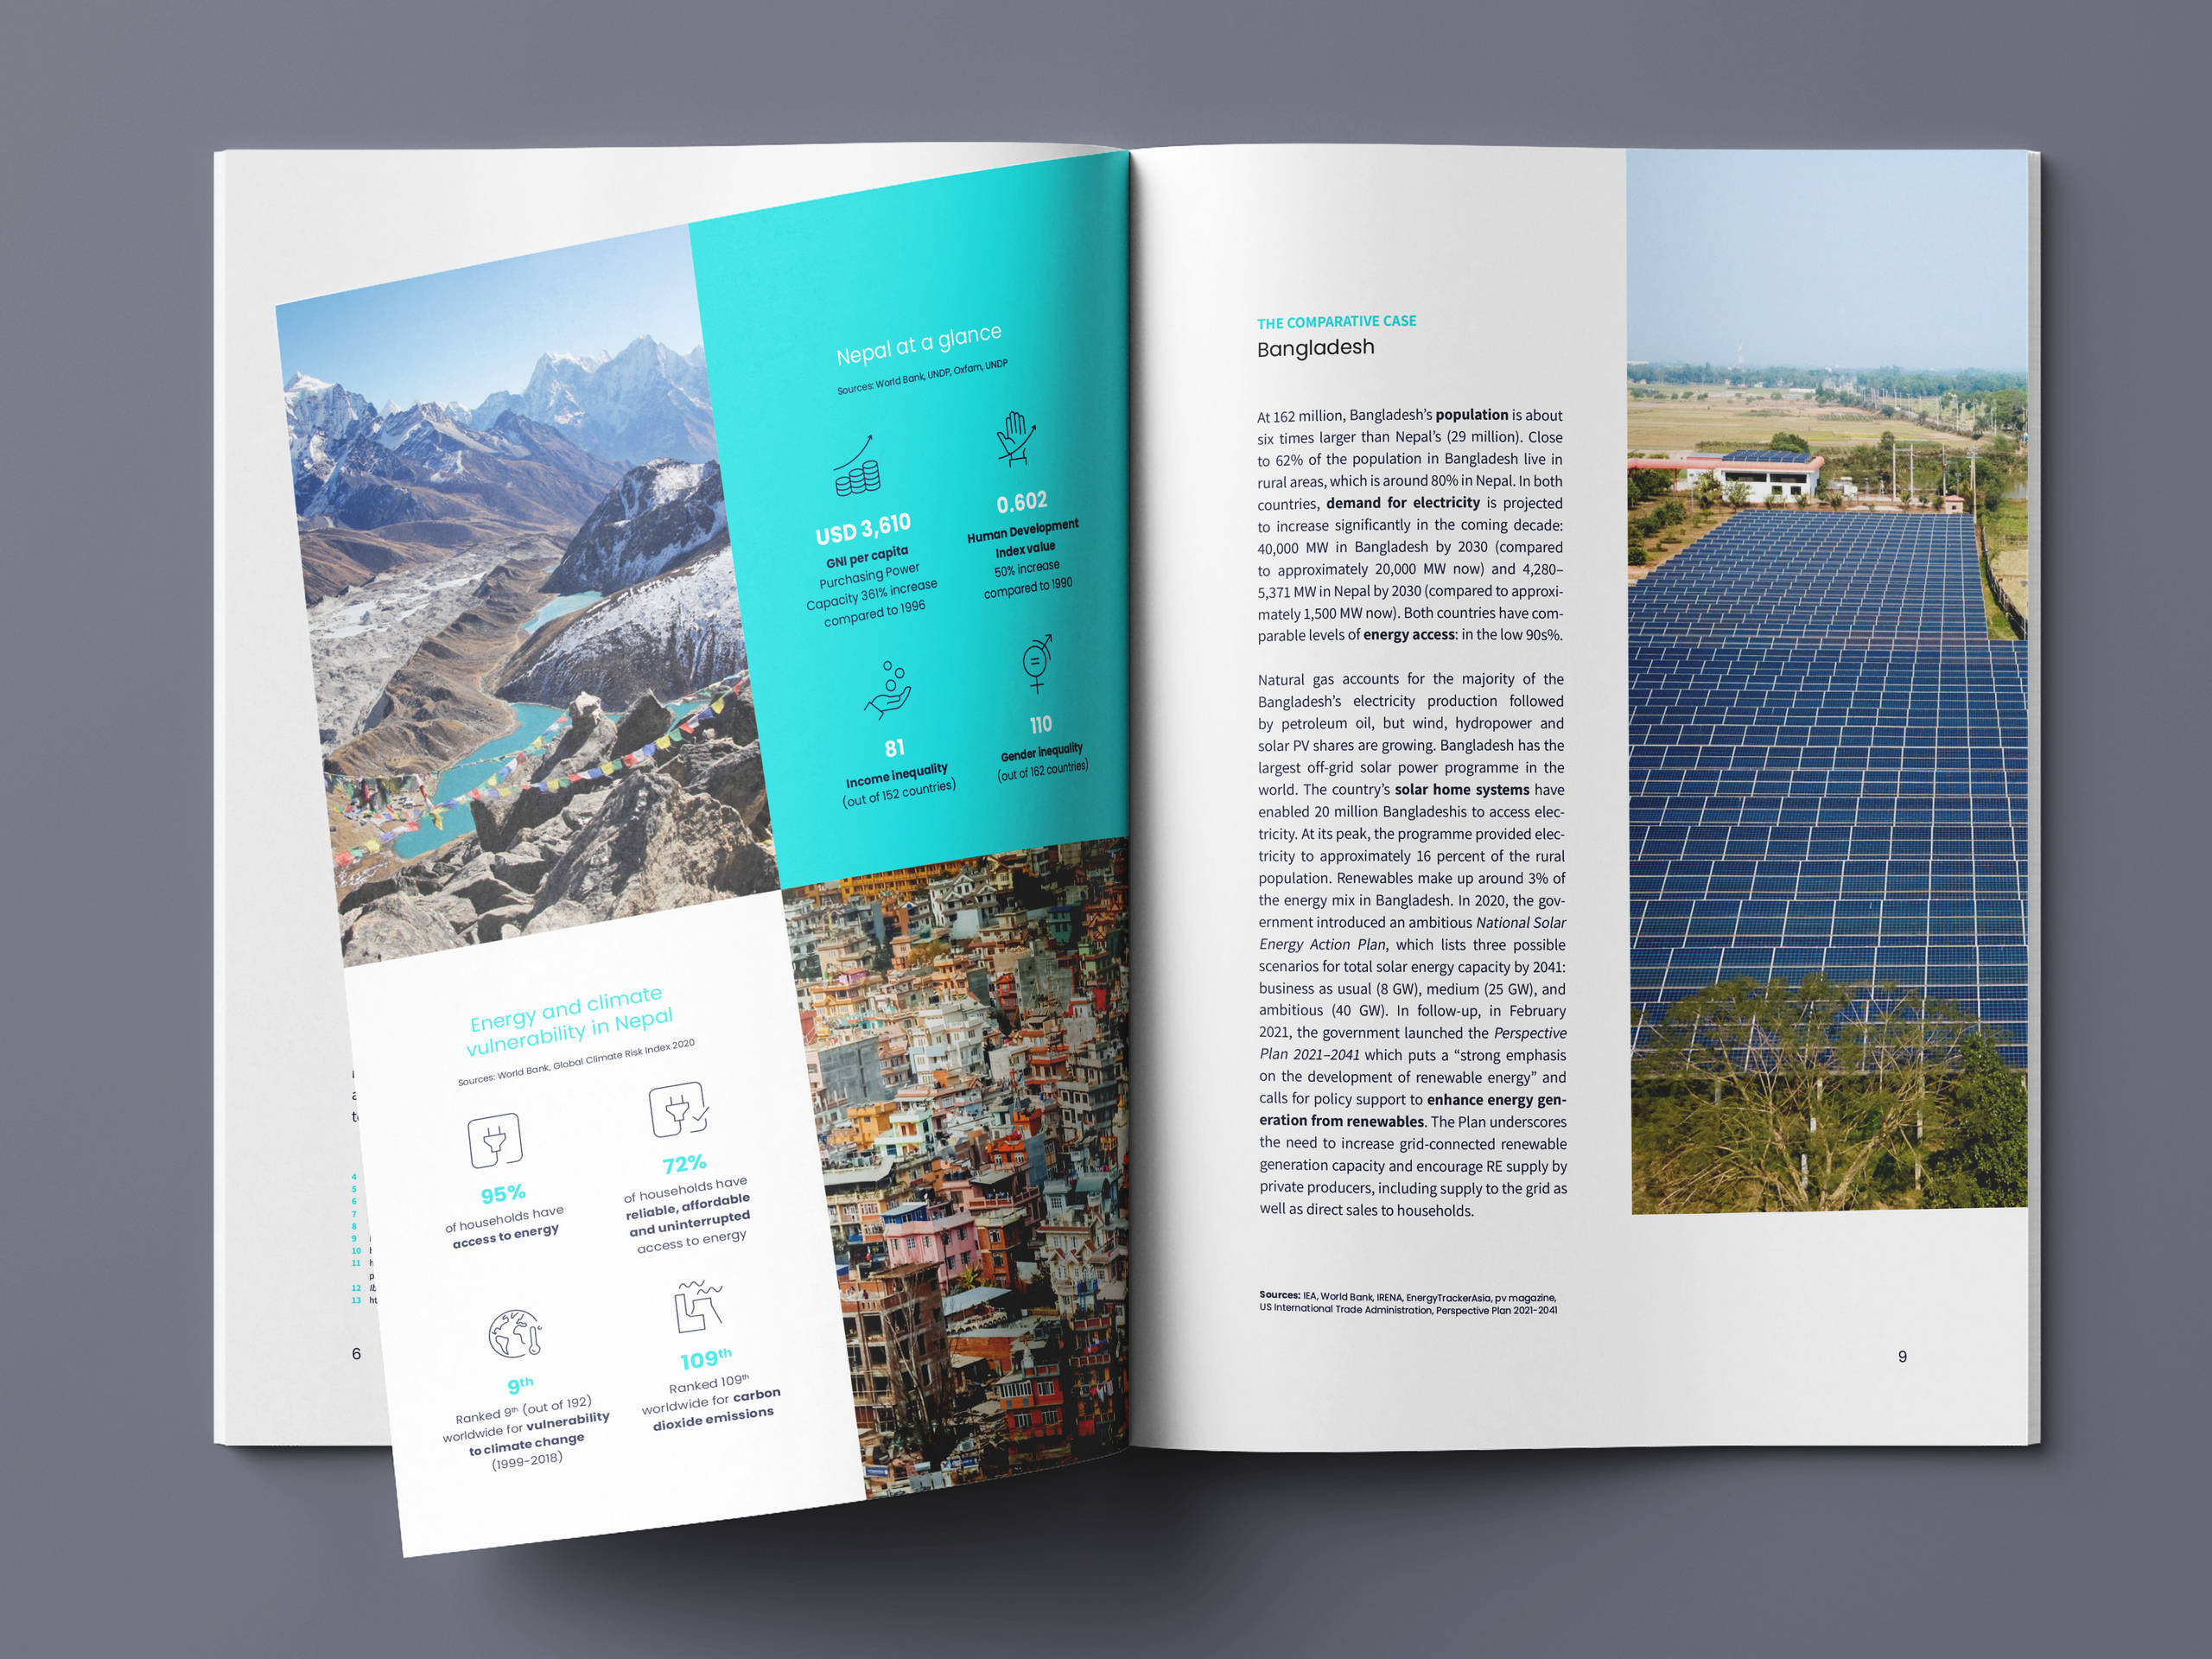
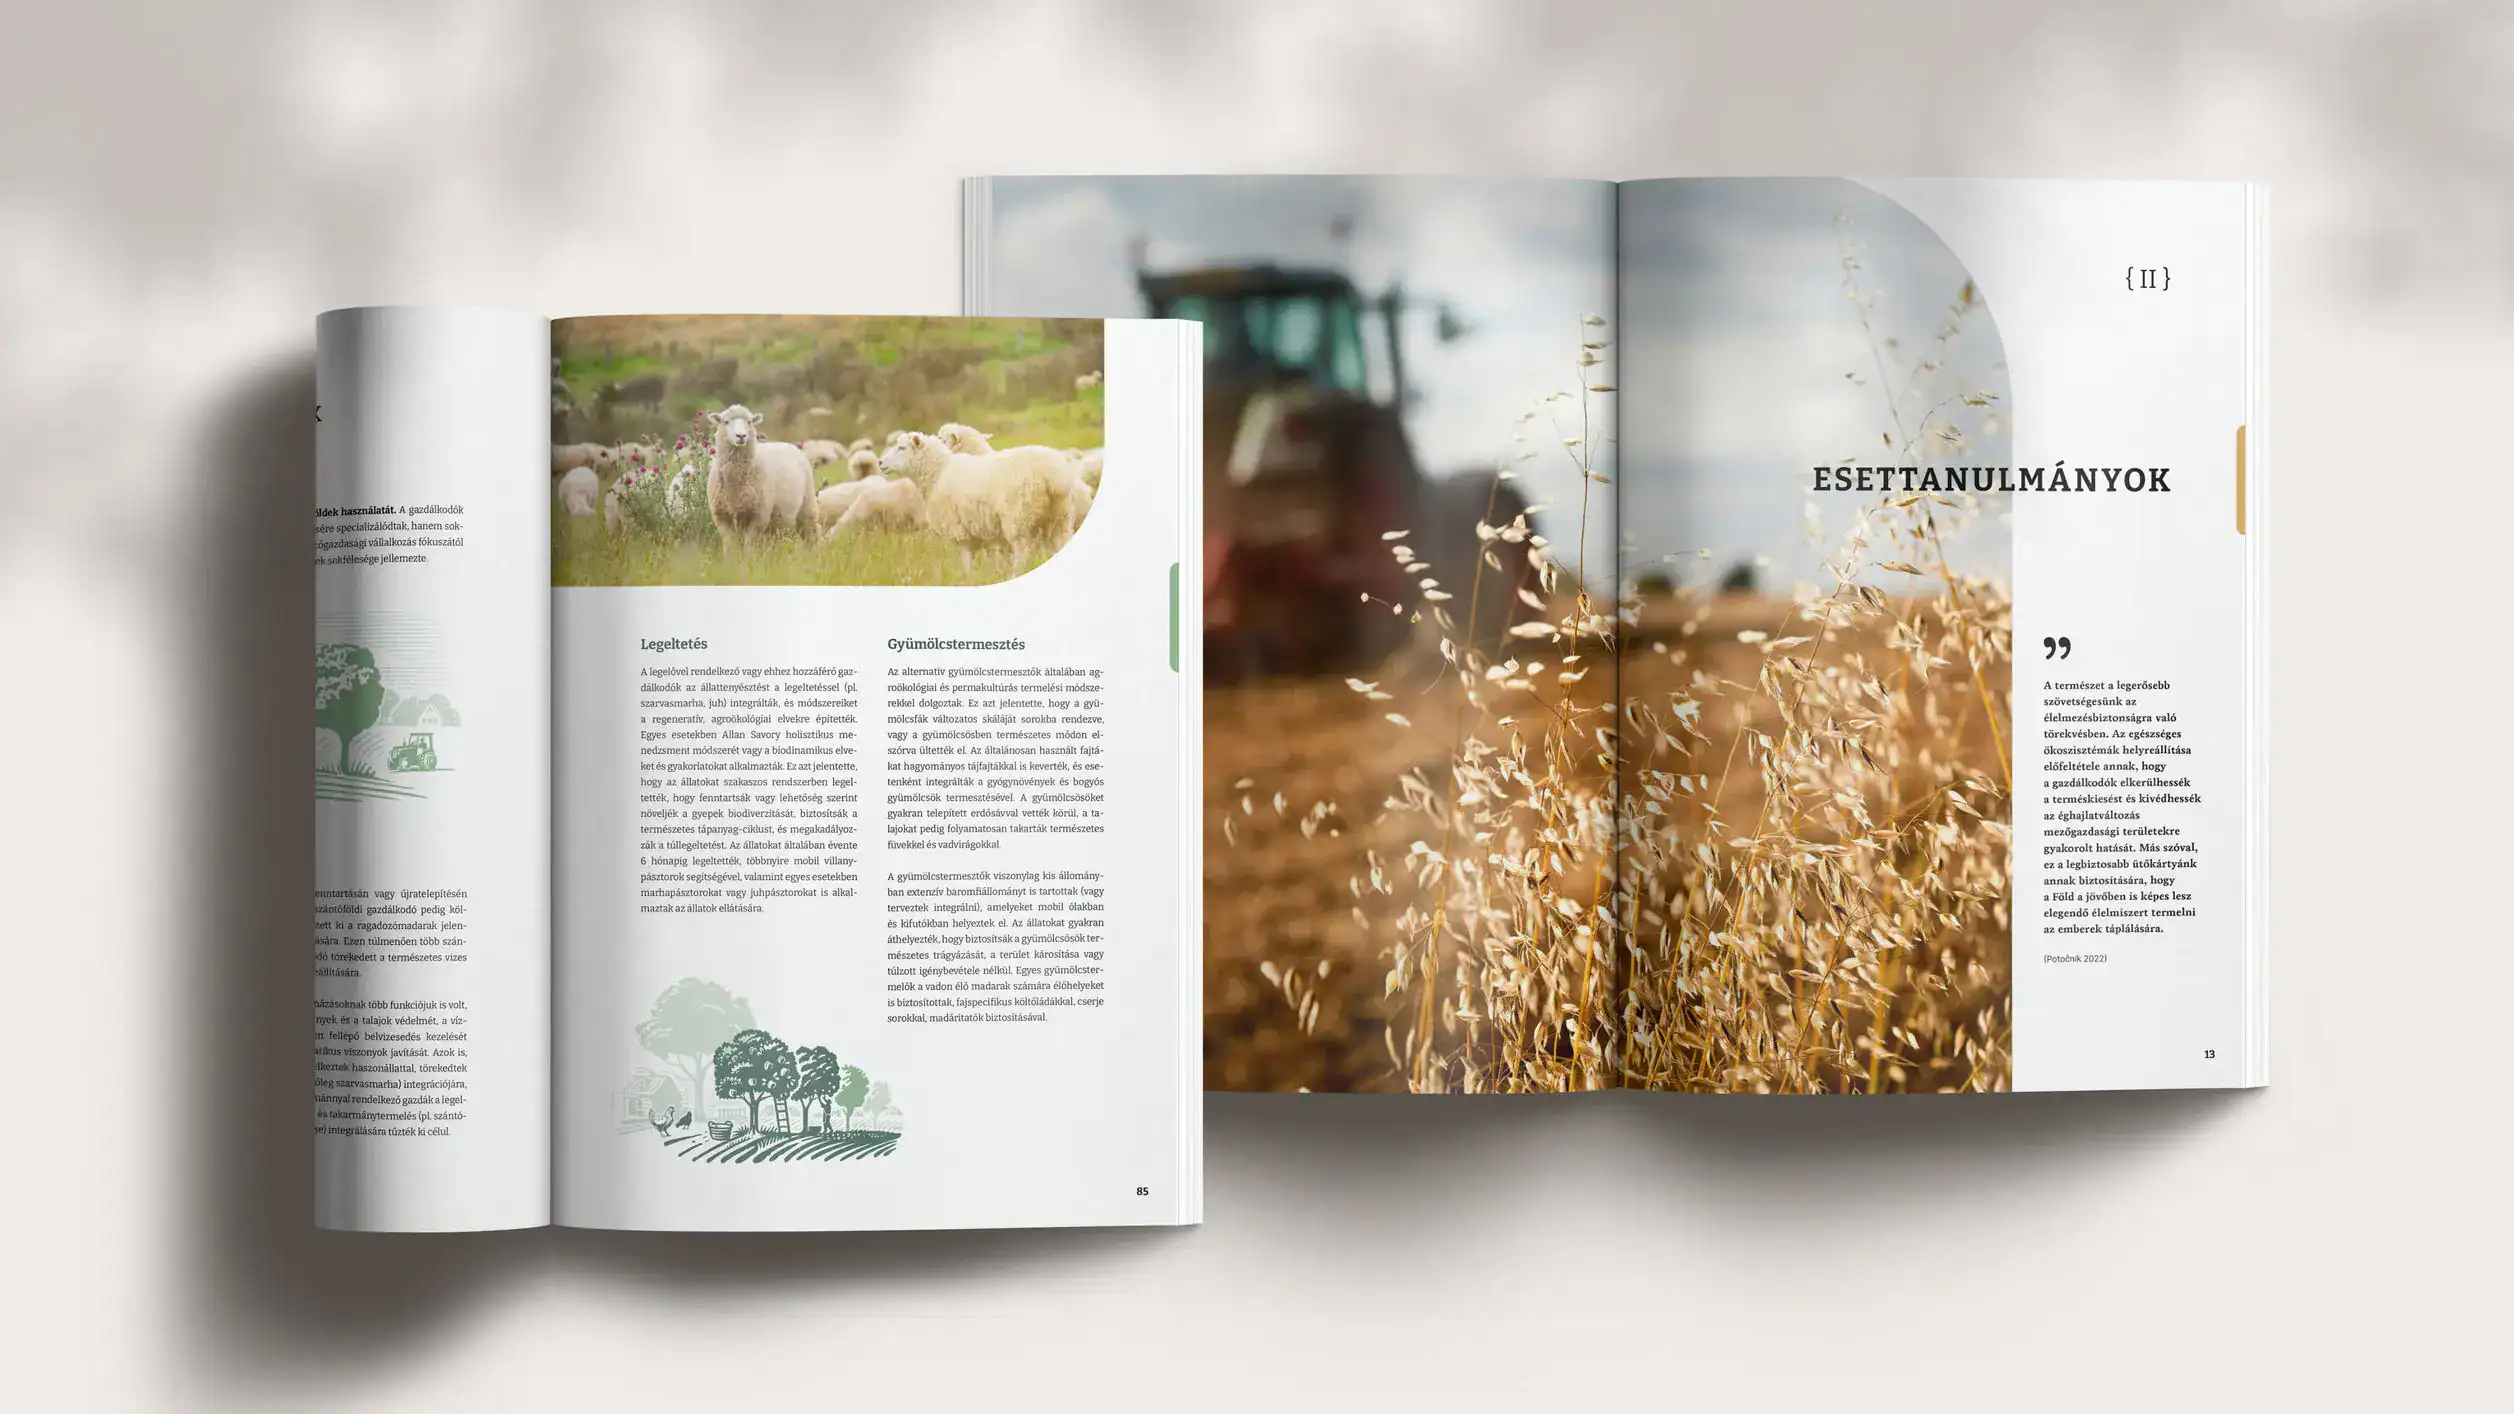
Academic research made structured and approachable for farmers and policy makers – illustrated concepts and a bespoke icon system for the farm interviews
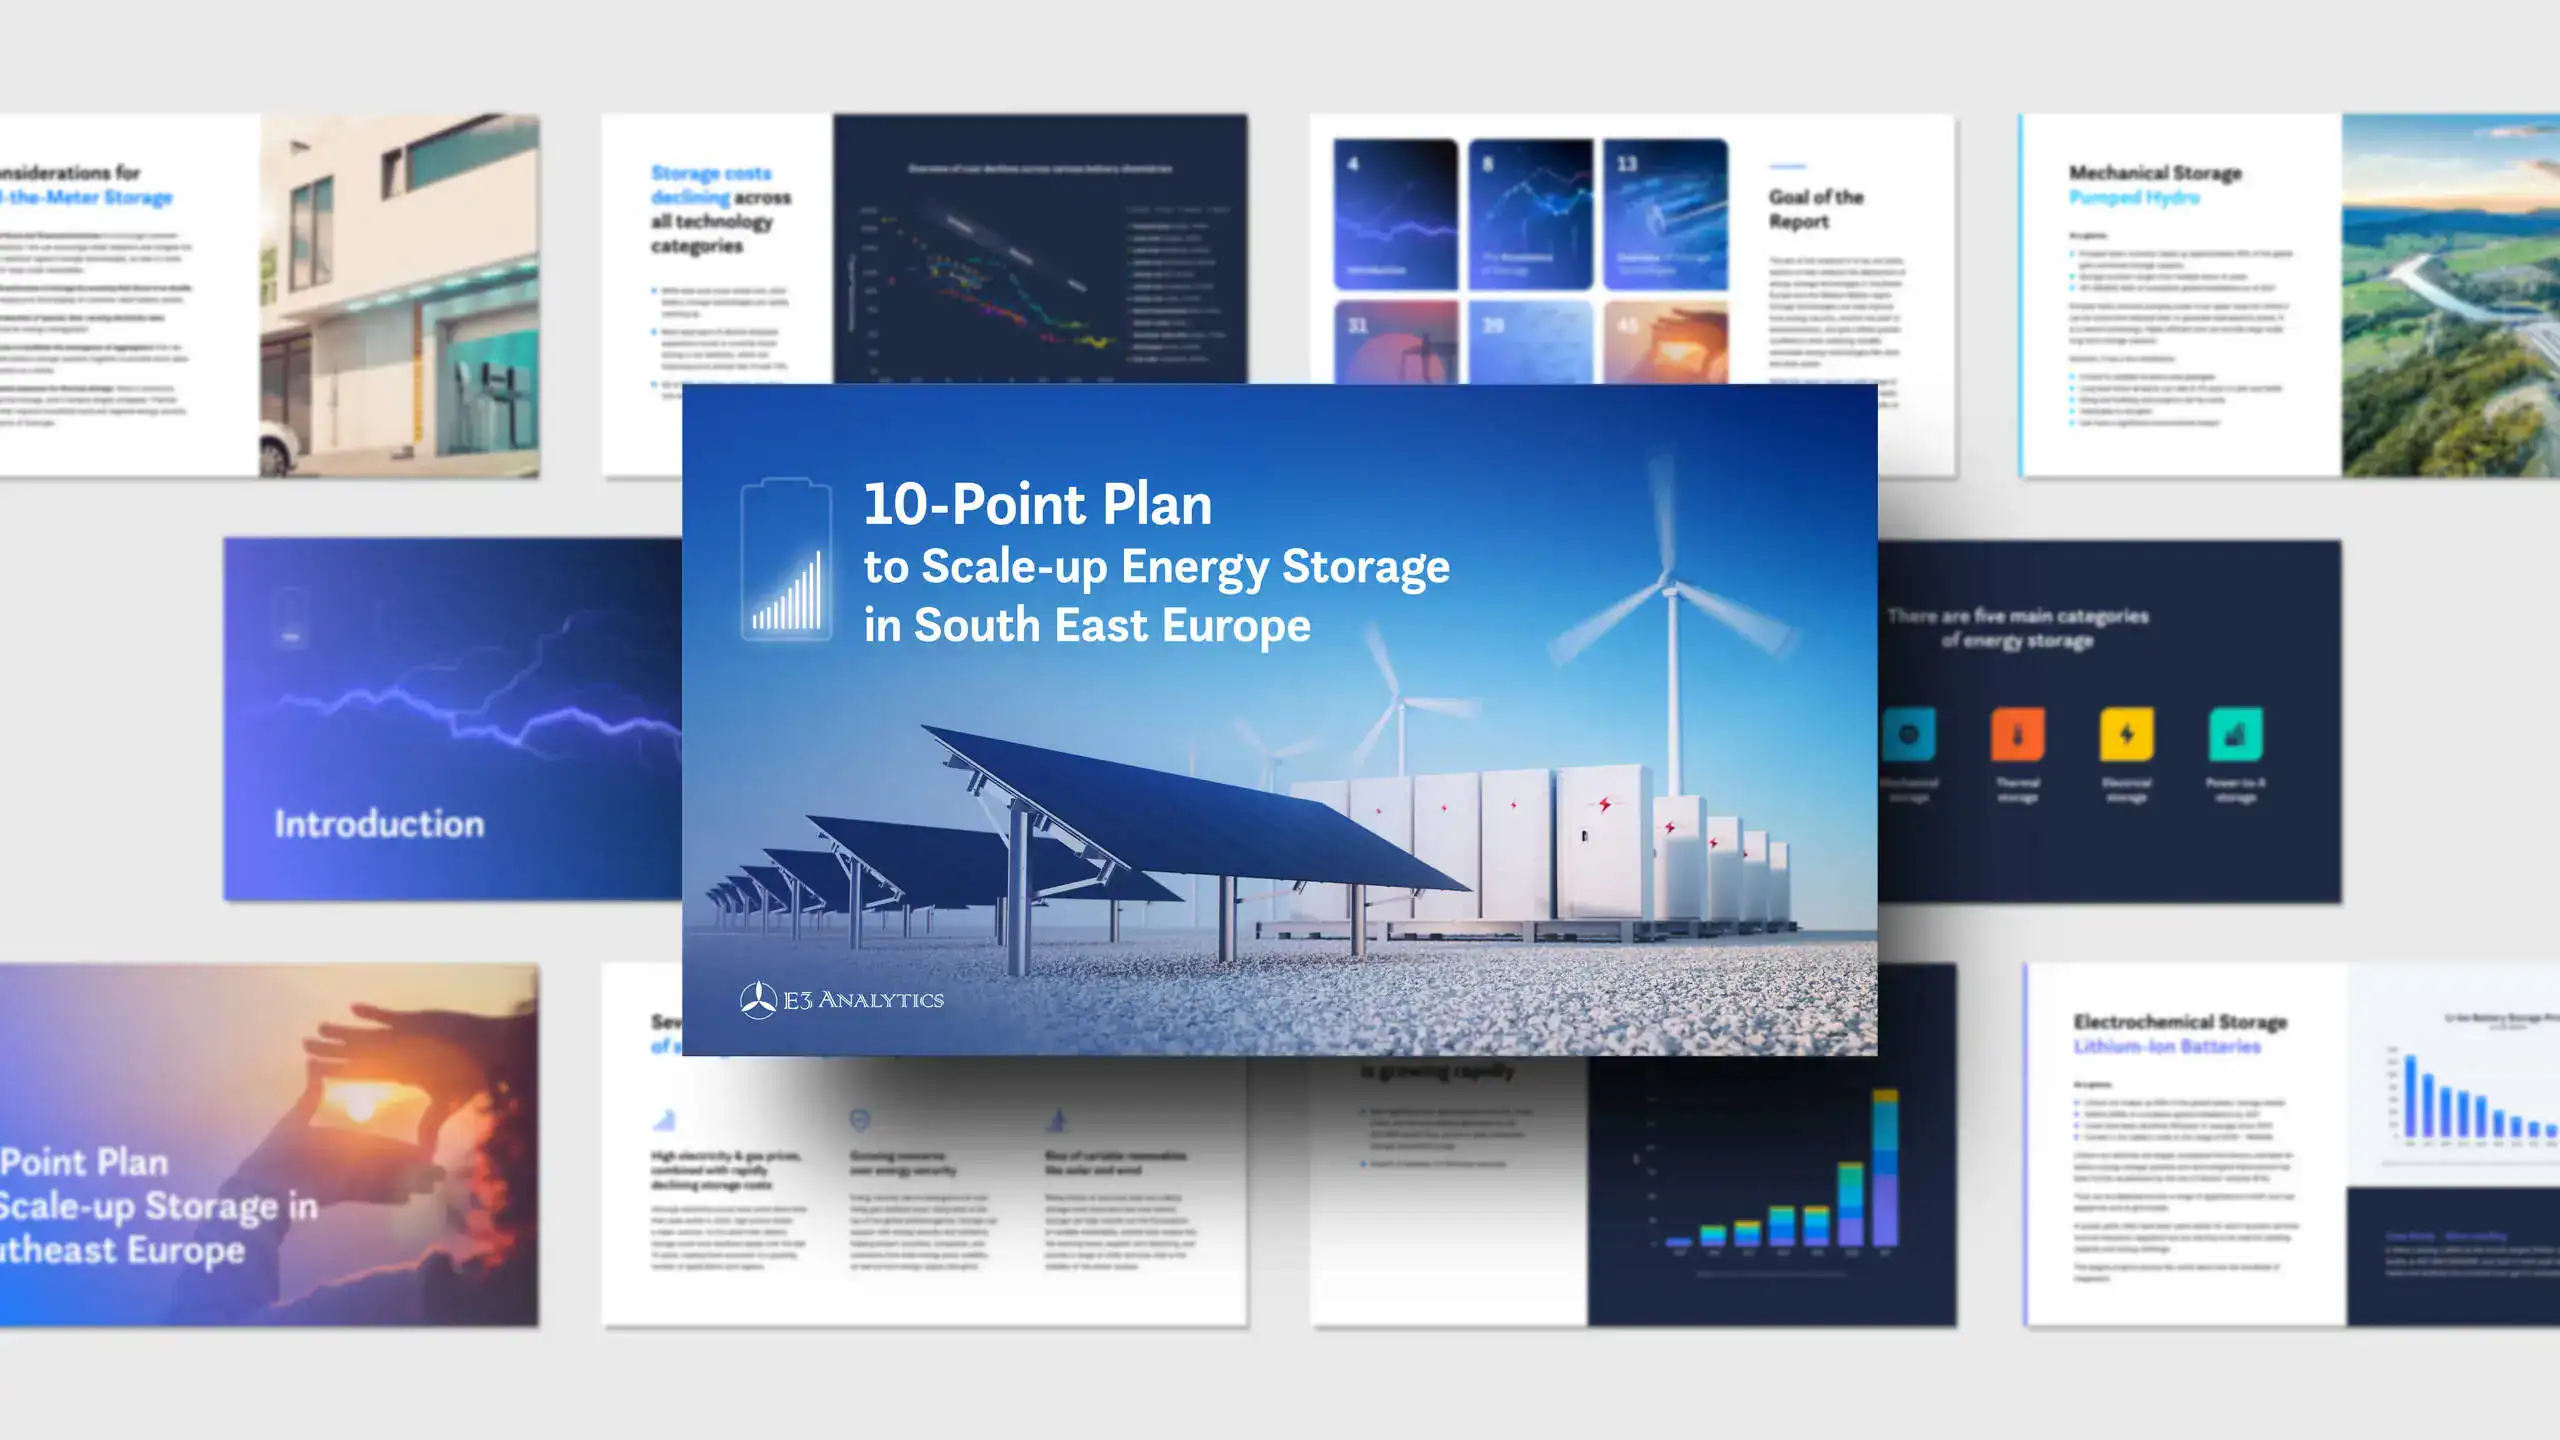
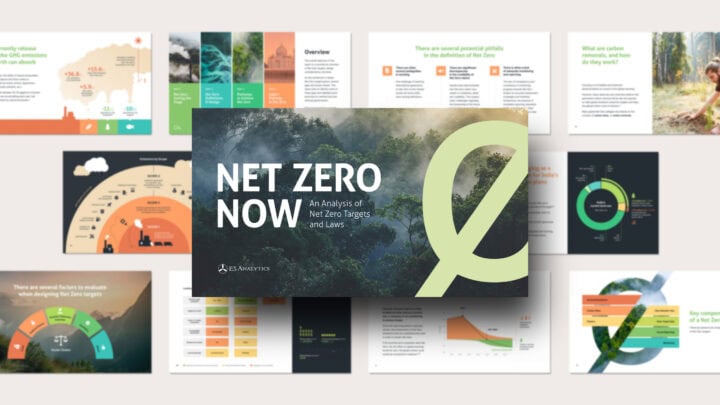
Slide-format research where the data supports the argument – rigorous, never dense, from unified charts to custom visual concepts
Reach out with a short description of your project. We’ll have a quick call about the publication, formats, and timeline, and you’ll receive a quote. The best time to reach out is 2–3 months before delivery: we’ll book your slot and agree a start date for the finished text.
I always design from final text: layout and flow depend on word counts and chapter structure, so mid-design rewrites mean redoing significant work.
Still writing, or only planning the publication – perhaps for a grant proposal? We can talk early. That’s the kind of conversation that becomes conceptual partnership.
You’ll need to share the final contents of your report — text (Word or Google Doc) and images/graphics as separate files — on the agreed start date, unless we arrange otherwise.
Revisions follow standard publishing practice. After you receive the first draft PDF, you’ll mark requested changes using PDF commenting tools (a short guide is provided). Optionally, InCopy can be used if your team is familiar with it.
It’s best practice to provide a proofread version before design begins. This minimizes the number of text edits and makes the review process faster and smoother.
After accepting my offer, we’ll sign a simple contract covering scope, deadlines, and pricing (in EUR).
EU clients: invoiced in EUR, payable by wire transfer (IBAN). B2B invoices follow the reverse charge system.
Switzerland, UK, USA: invoices can be issued in CHF, GBP, or USD on request. Payments go to local accounts (via Wise.com at established banks).
Inquiry & offer – Send your request via this website. If I can accommodate your project, I’ll prepare a tailored offer with pricing and timeline.
Contract – Once you agree, we sign a simple contract.
Submission of content – Provide all report materials (text + images) on the agreed start date.
Partial draft – If new styling is needed, I’ll first share sample pages for approval.
First draft – You’ll receive a complete PDF draft of your publication.
Revisions – Up to 3 revision cycles are included. Comments are best marked directly in the PDF (guide provided).
Final delivery – I’ll deliver the final print-ready PDF and, if requested, the InDesign source files. You retain full rights to use and adapt the design.
Timelines vary with length and complexity. A 30-page report may take 2–3 weeks, while more complex publications (with charts and infographics) can take 4–6 weeks.
Yes. Most clients reserve a production slot 2–3 months ahead of delivery. Booking early guarantees your deadline and gives you a clear timeline for finalizing the text. It also allows me to plan my schedule and ensure I can dedicate full attention to your project.
If you need the design sooner, rush delivery may be possible for an extra charge, subject to availability.
I’d love to hear about it. Most clients reach out 2–3 months ahead of delivery, but it’s also fine to get in touch earlier, when scope isn’t yet clear. Happy to jump on a short call to talk it through, or answer questions by email.
Or email me directly at info@hot-ice.eu
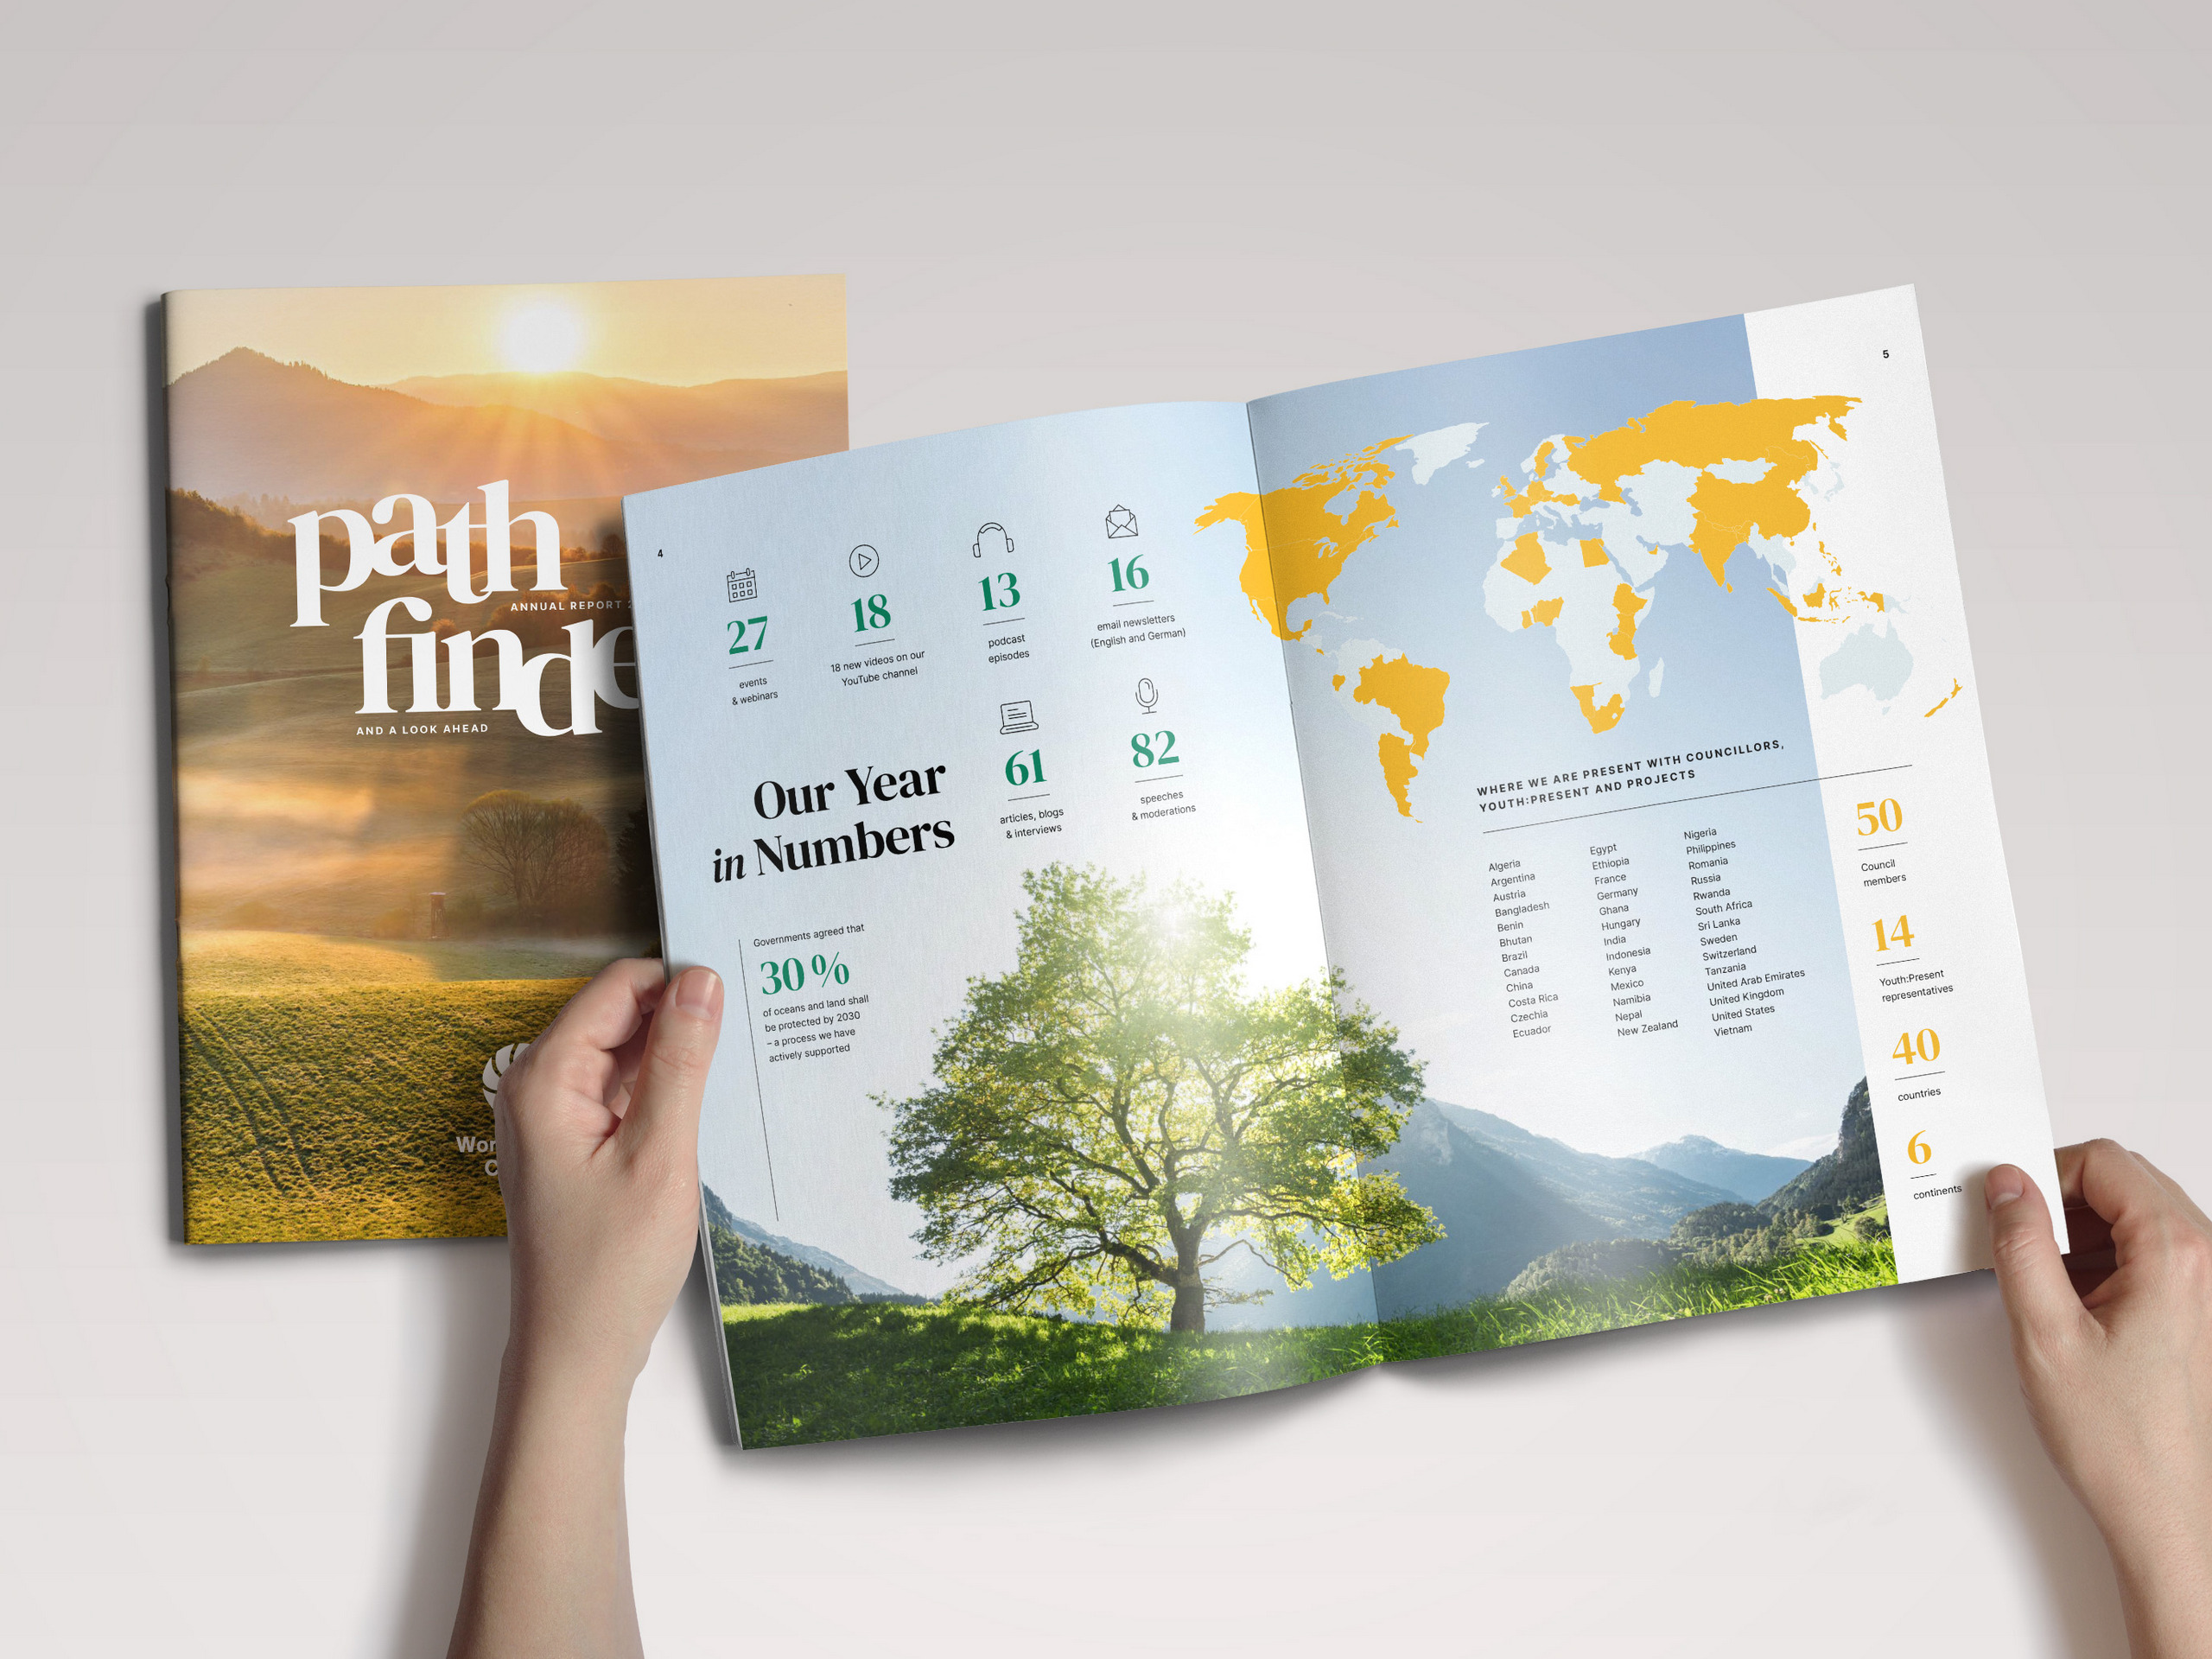
Editorial-grade design for annual reports that speak to donors, boards, and the public.
Creative design to visualize serious data. Charts, concepts, and figures made readable for your audience.
Reports and their adaptations in Latin and non-Latin scripts, such as Arabic, Chinese, and Japanese.
Consultations on publication flow and infographic concepts before the design phase.