
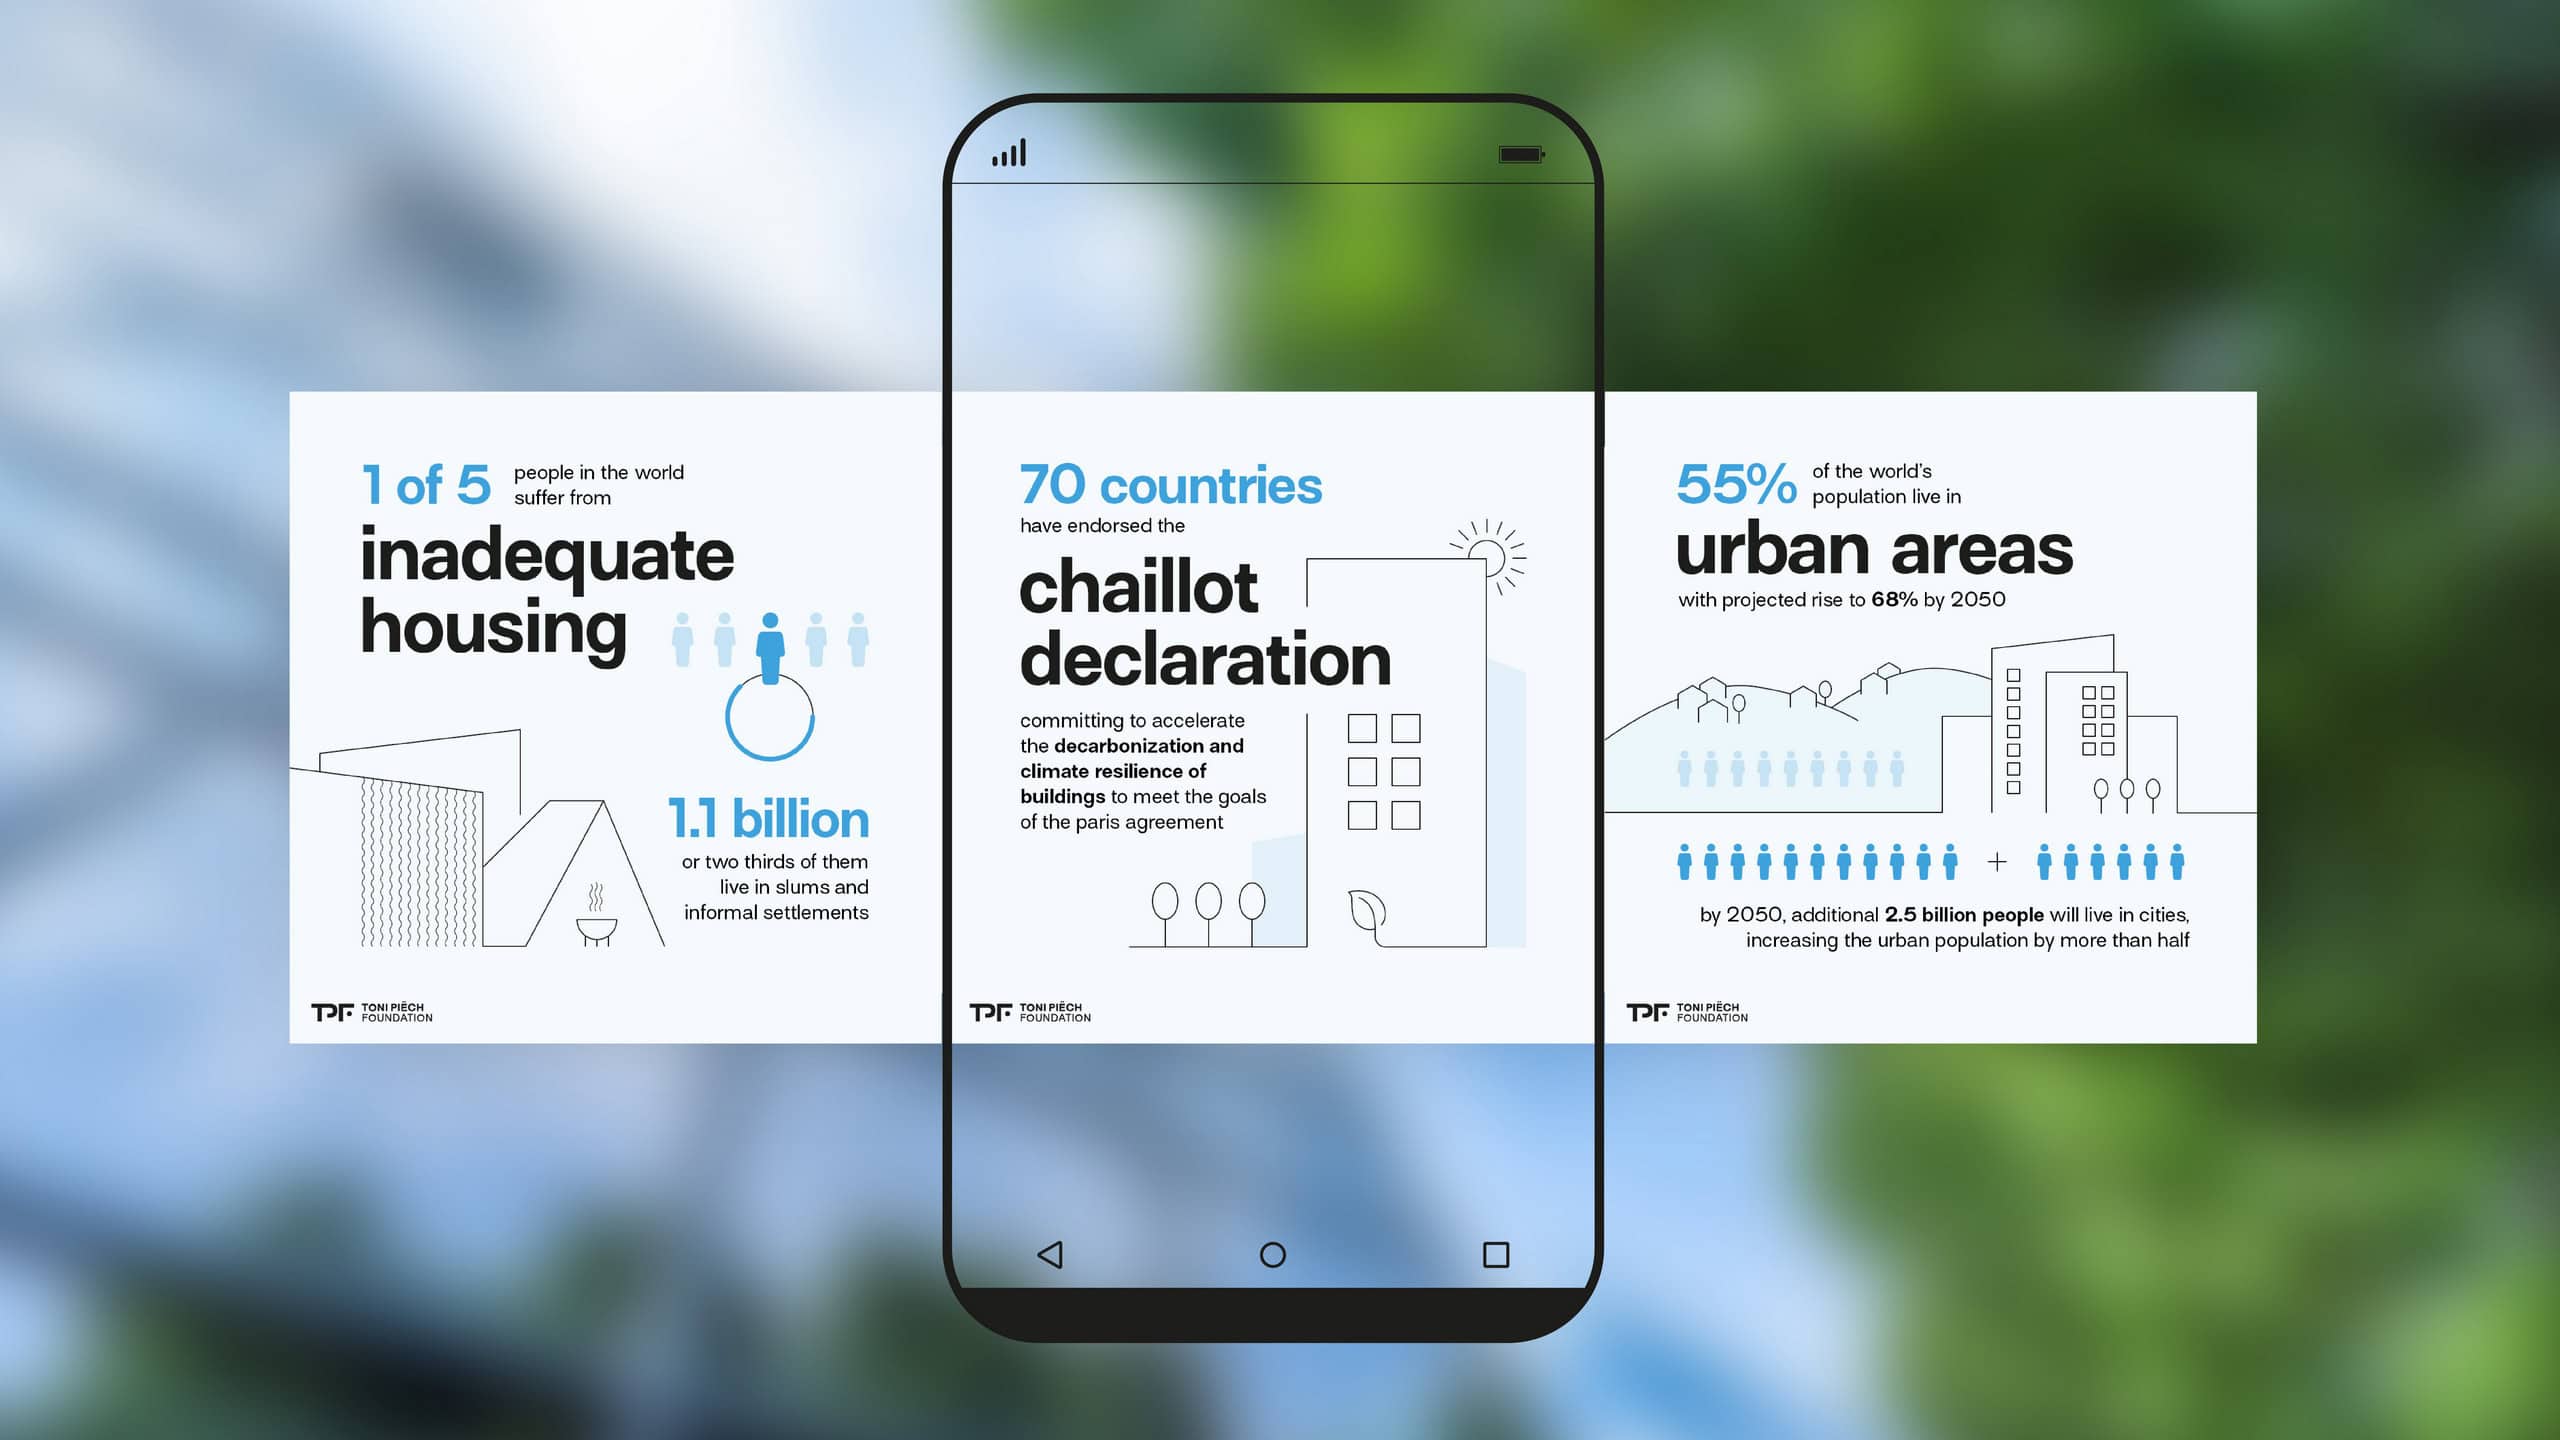
In March 2024, seventy countries signed the Déclaration de Chaillot, a commitment to decarbonization and climate resilience in the buildings sector. The Toni Piëch Foundation wanted the world to notice. They provided the declaration text with a handful of highlighted facts, and complete freedom in how to approach the assignment.
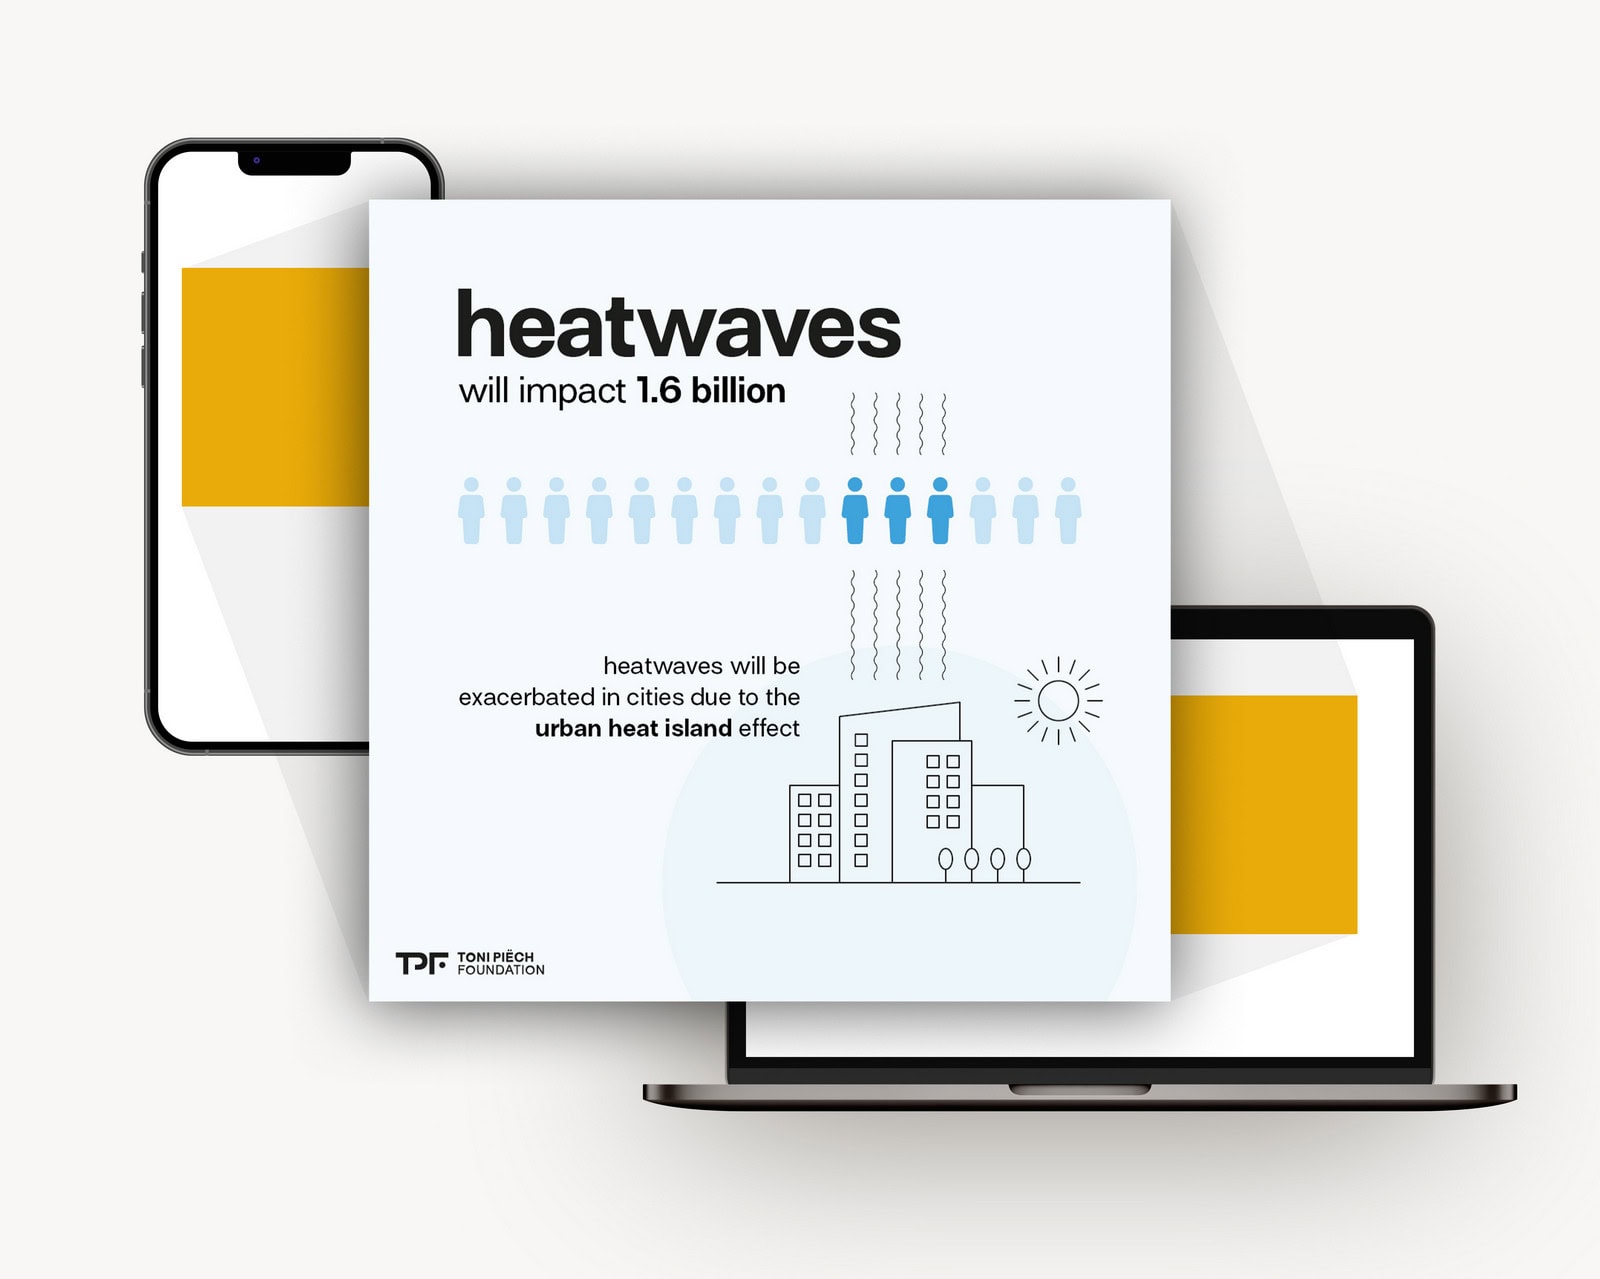
While their previous agency had considered a poster, I instead proposed a series of standalone infographic cards. Each card would carry one fact and work on its own as a social media post, in sequence as a carousel, or as an image dropped into documents and presentations. The client agreed, and the series grew to eight cards covering the declaration’s core facts.
Every card in the series follows the same principle I apply across my data visualization work – a number lands fastest when it appears in context, with scale and comparison made visual.
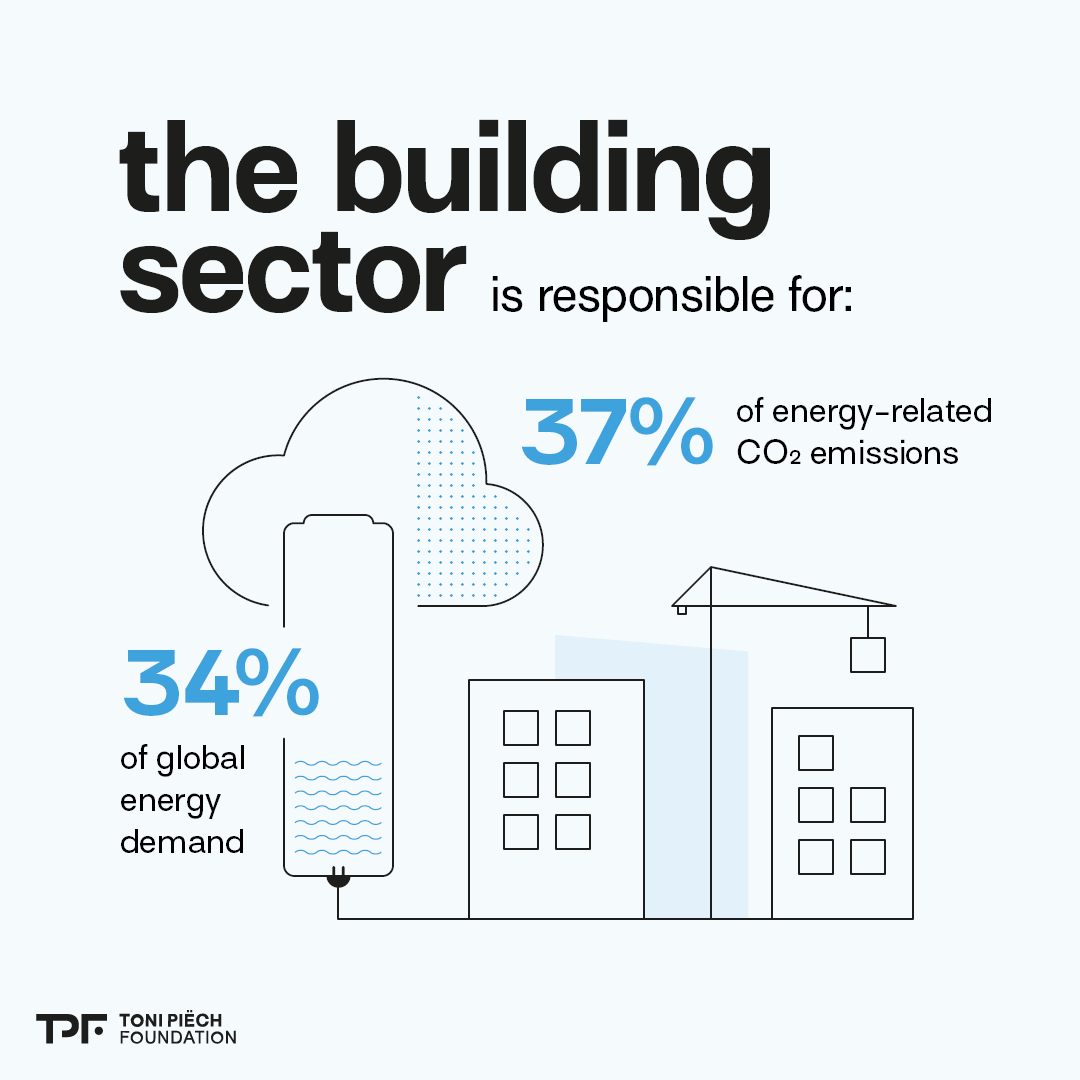
For instance, to show what the building sector does to the climate, I drew its 34% share of global energy demand as the charge level of a battery, and its 37% of energy-related CO₂ emissions as the dotted fill of a cloud.
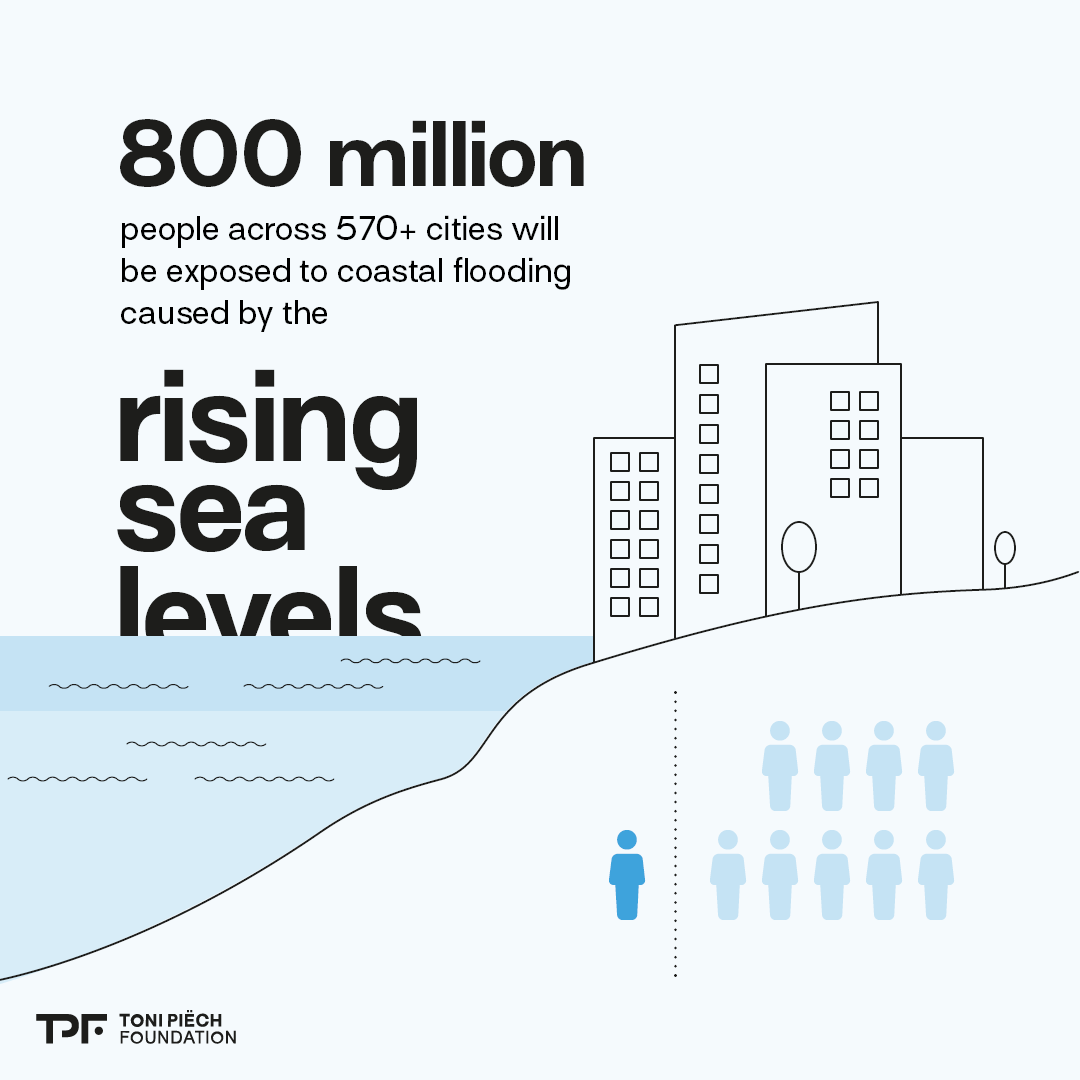
The rising sea levels card depicts a coastal city on a slope, with its lower streets under water. Icons show the 10% of the world’s population that would be affected, in proportion to the rest who wouldn’t.
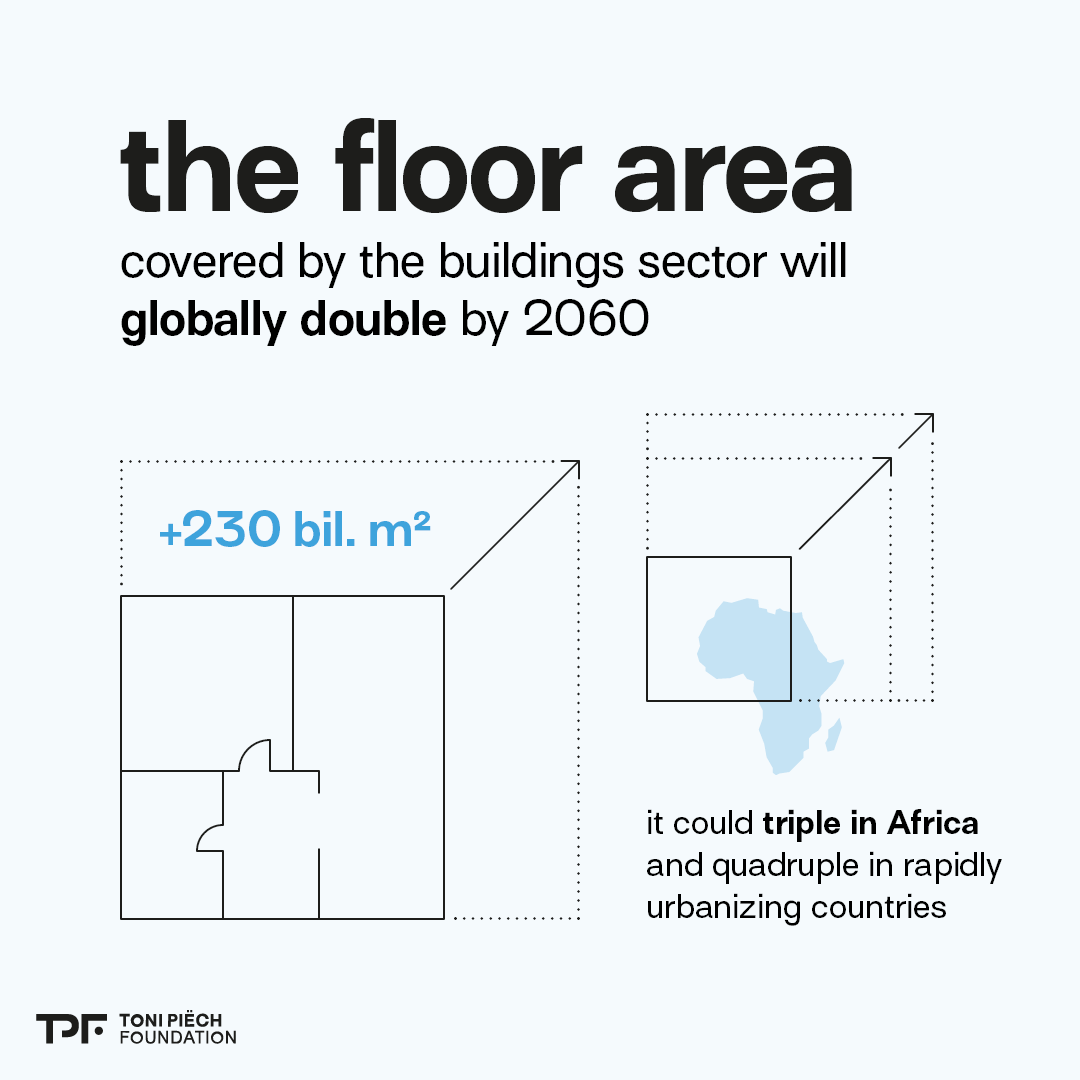
And where the world’s built floor area is projected to double by 2060, a floor plan simply outgrows its own outline, with a second, steeper trajectory for Africa and rapidly urbanizing countries.
"After a previous designer couldn’t turn our complex information into usable designs, Jana developed an entirely new design strategy and created intuitive, beautifully clear slides, and she was a genuine pleasure to work with throughout."
Jonas Hiller, Research & Project Manager, Toni Piëch Foundation
What happened next
The series ran on the foundation’s channels. They later took the format further, building the graphics into an online tool where the cards could be colour-customized and shared – a design system that outgrew its original assignment.
The project became the start of an ongoing relationship. I’ve since designed the foundation’s annual reports and further publications.